12. I followed Korean buyback disclosures
Event timing, liquidity, and what happened when I increased position sizes.
Investing on my own · Part 12/22 · Evidence through 2026-09-22. Historical research is distinct from DRY and live execution.
My research was not limited to crypto. In Korean equities, I examined trading after share-buyback disclosures: did holding a stock for a defined period after the announcement produce a useful effect?
I started from a relatively clear event rather than a broad judgment that a company was good. Even then, an announced repurchase plan and a completed repurchase were different facts. The dataset needed to preserve that distinction.
📄 Buying on the following day
The main event types were direct treasury-share acquisitions and buyback trust contracts. I linked DART disclosures to stocks and historical trading data. Repeated announcements by the same company also needed controls so that one continuing program did not become an unlimited series of independent events.
The baseline applied a 60-day cooldown to each company–event-type combination. It assumed entry at the following day’s volume-weighted average price, or VWAP.
VWAP is an average of observed trading prices weighted by volume. It is not a guarantee that my own order could execute at exactly that price. Here it served as a consistent execution proxy and avoided buying at a same-day close with information that might not yet have been available.
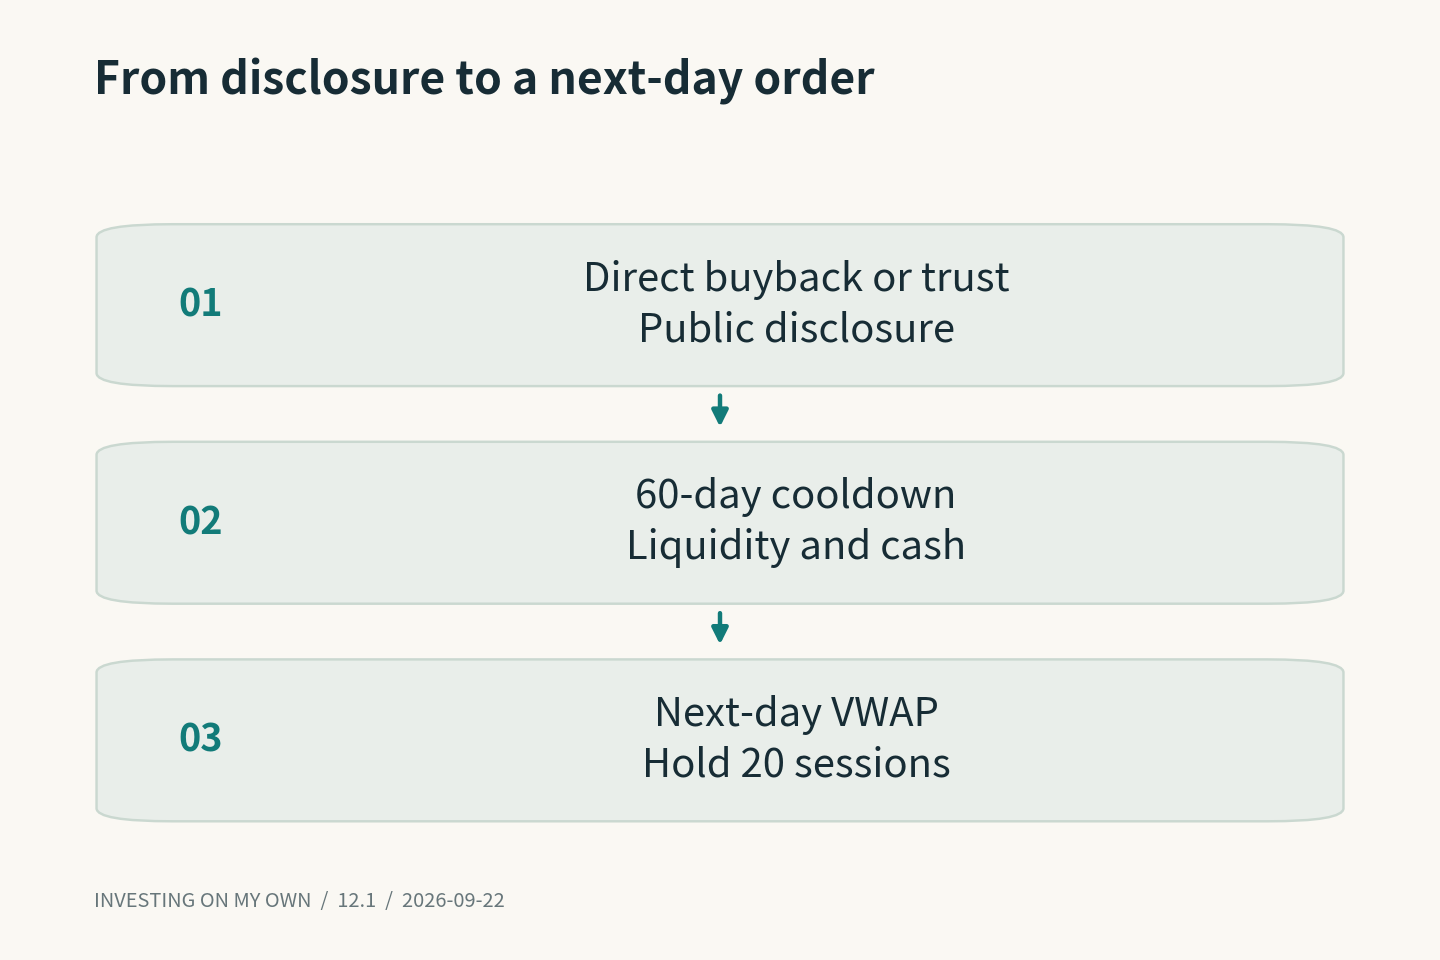
The baseline focused on stocks with a trailing 20-day median traded value below KRW 1 billion. It allocated 5% of portfolio assets to an event and held for 20 trading days. The model included a 3-basis-point fee assumption, 10-basis-point slippage, and a sell-side tax assumption.
Those were historical experiment settings, not current tax or brokerage guidance. Low turnover was relevant because a repurchase could represent meaningful demand relative to ordinary trading. It also made my own entry more difficult.
📊 Looking across periods
The baseline compound annual growth rate was 24.90% in training from 2010 through 2018, 17.26% in validation from 2019 through 2023, and 17.43% in the 2024–2025 follow-up period.
Validation maximum drawdown was negative 30.89%. A positive annualized return did not mean a comfortable path. The strategy had to be understood alongside a decline of more than 30% from a prior portfolio peak.
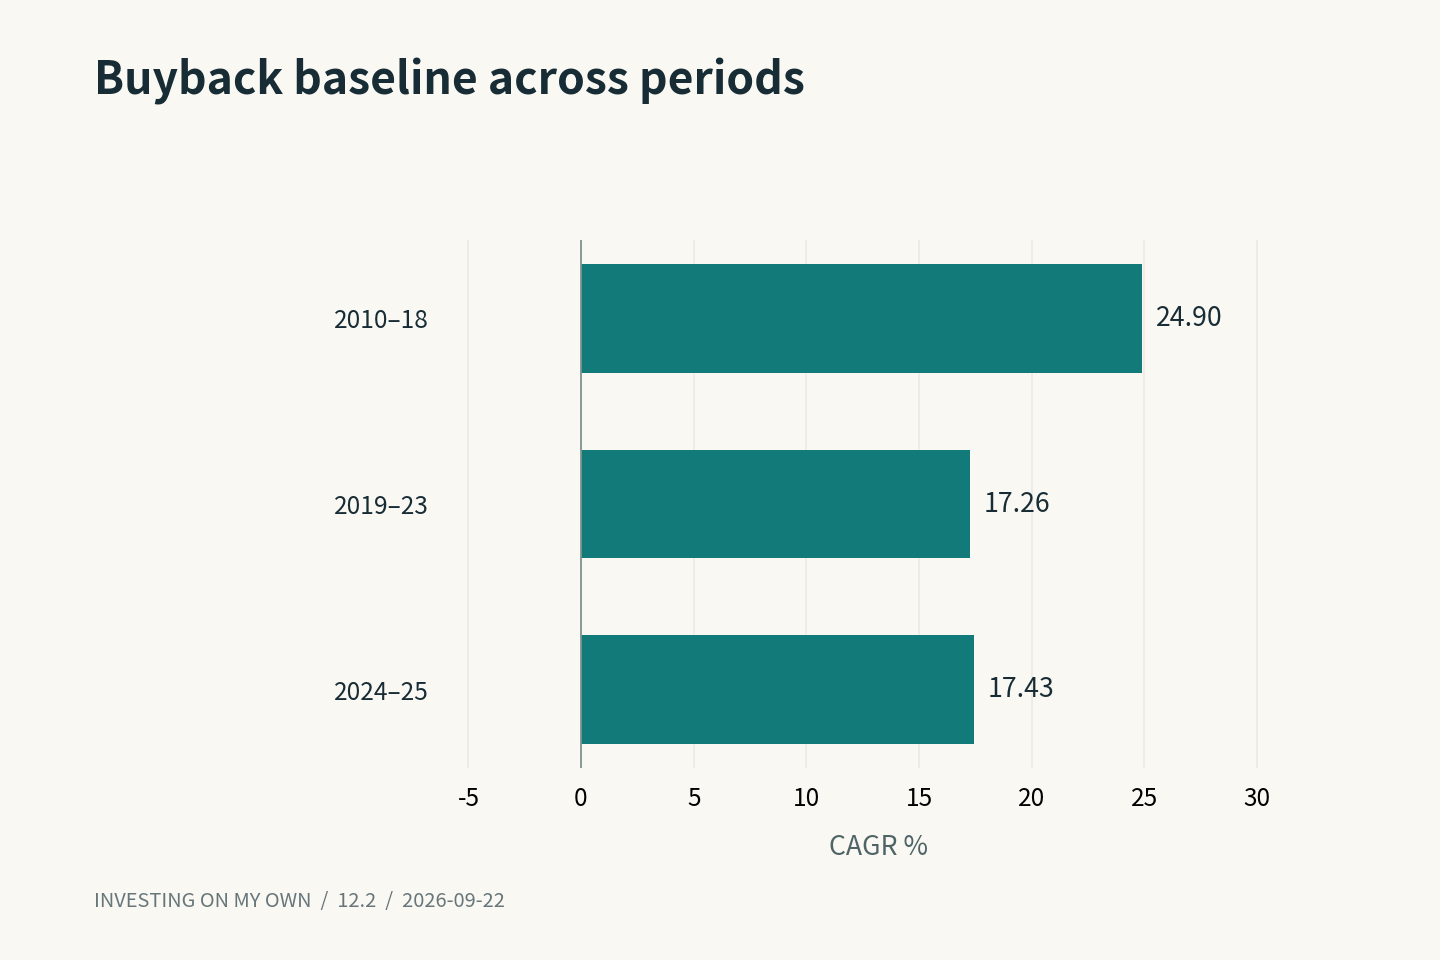
The 2024–2025 data had already been examined during the research. I treated it as a follow-up period, not a completely new untouched holdout. I also avoided combining attractive numbers from experiments with different settings into a fictional single result.
Other disclosure extensions were less successful. None of the 29 alternatives in that evaluated bundle passed the specified criteria. A shared association with buybacks did not make all event definitions equivalent.
🪣 What happened when I increased sizing?
Because I was researching with a small-capital perspective, capacity was particularly interesting. Would the apparent effect survive if I tried to allocate more money to each event?
In a separate sizing experiment, target allocations of 5%, 10%, 20%, and 50% produced follow-up annualized returns of 17.78%, 10.59%, 3.78%, and negative 1.46%. Maximum drawdowns were negative 12.51%, 15.96%, 16.89%, and 29.58%.
The 5% result differs slightly from the earlier baseline because it came from a separate replay configuration. I have kept them distinct rather than presenting both as measurements of one identical run.
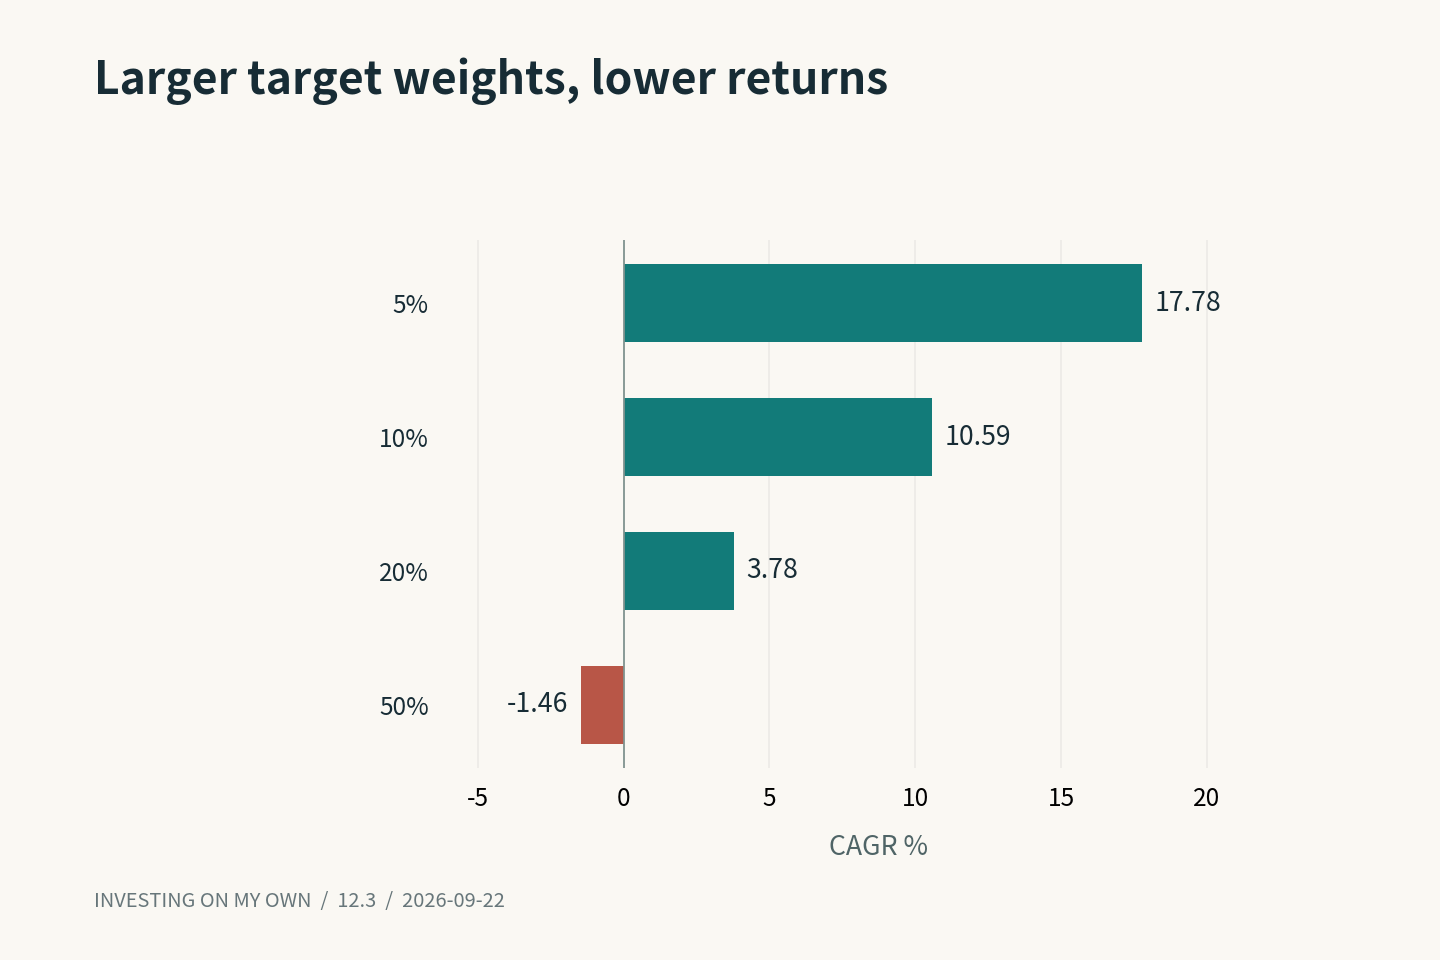
Average holdings fell from approximately 16.09 stocks to 1.77. The proportion of requested orders filled under the model’s constraints fell from 66.3% to 7.3%. Increasing the target weight in a configuration file did not create more market liquidity.
Larger allocations could also leave no cash for the next disclosure. Participation limits could prevent the intended purchase, while concentration changed the portfolio path. A 50% setting was therefore not just a magnified version of the 5% strategy.
I examined first-hour execution extensions and higher slippage assumptions too. Some apparent performance remained, but the incremental effect became smaller after matching comparison conditions. An improvement caused by changing the execution proxy should not be attributed entirely to a stronger disclosure signal.
All of these results came from historical portfolio replays. They were not evidence that a brokerage account had achieved the same returns. Collecting a disclosure, producing a portfolio target, and obtaining a real equity fill remained separate steps.
Buybacks were an accessible way to explain the idea. Understanding the results required more attention to liquidity and capital allocation than to the announcement headline itself.
This was one of the places where I could see why a small account might not be disadvantaged in every respect. That observation was conditional, though. Being small did not automatically create an edge; it only changed which capacity constraints were likely to matter first.
Previous · Series index · Next