15. Gold had different prices in different markets
Currency, grams, ounces, and redemption conditions changed the apparent gap.
Investing on my own · Part 15/22 · Evidence through 2026-09-22. Historical research is distinct from DRY and live execution.
Gold is gold, but its price differs across markets. I compared Korean KRX gold, overseas gold futures, and gold-backed tokens to see whether those differences could support a trade.
It extended the cross-market questions I had been asking in crypto. The familiar asset name concealed substantial differences in units, contract sizes, and the ways a position could ultimately be redeemed or closed.
🥇 Won per gram versus dollars per ounce
KRX gold and overseas futures needed conversion into a common currency and weight unit before a premium or discount meant anything. A higher Korean price could reflect a weaker won rather than unusually expensive domestic gold.
Whether to retain or hedge the currency exposure was therefore part of the strategy. It was not a cosmetic adjustment to the chart.
Quantities mattered too. The researched domestic gold futures contract represented 100 grams, unlike the overseas micro contract’s 10 troy ounces. LBMA’s conversion defines one troy ounce as 31.1034768 grams. The overseas contract therefore represented approximately 311 grams, leaving about 11 grams unmatched against three domestic futures contracts. This was distinct from the order unit for domestic gold spot.
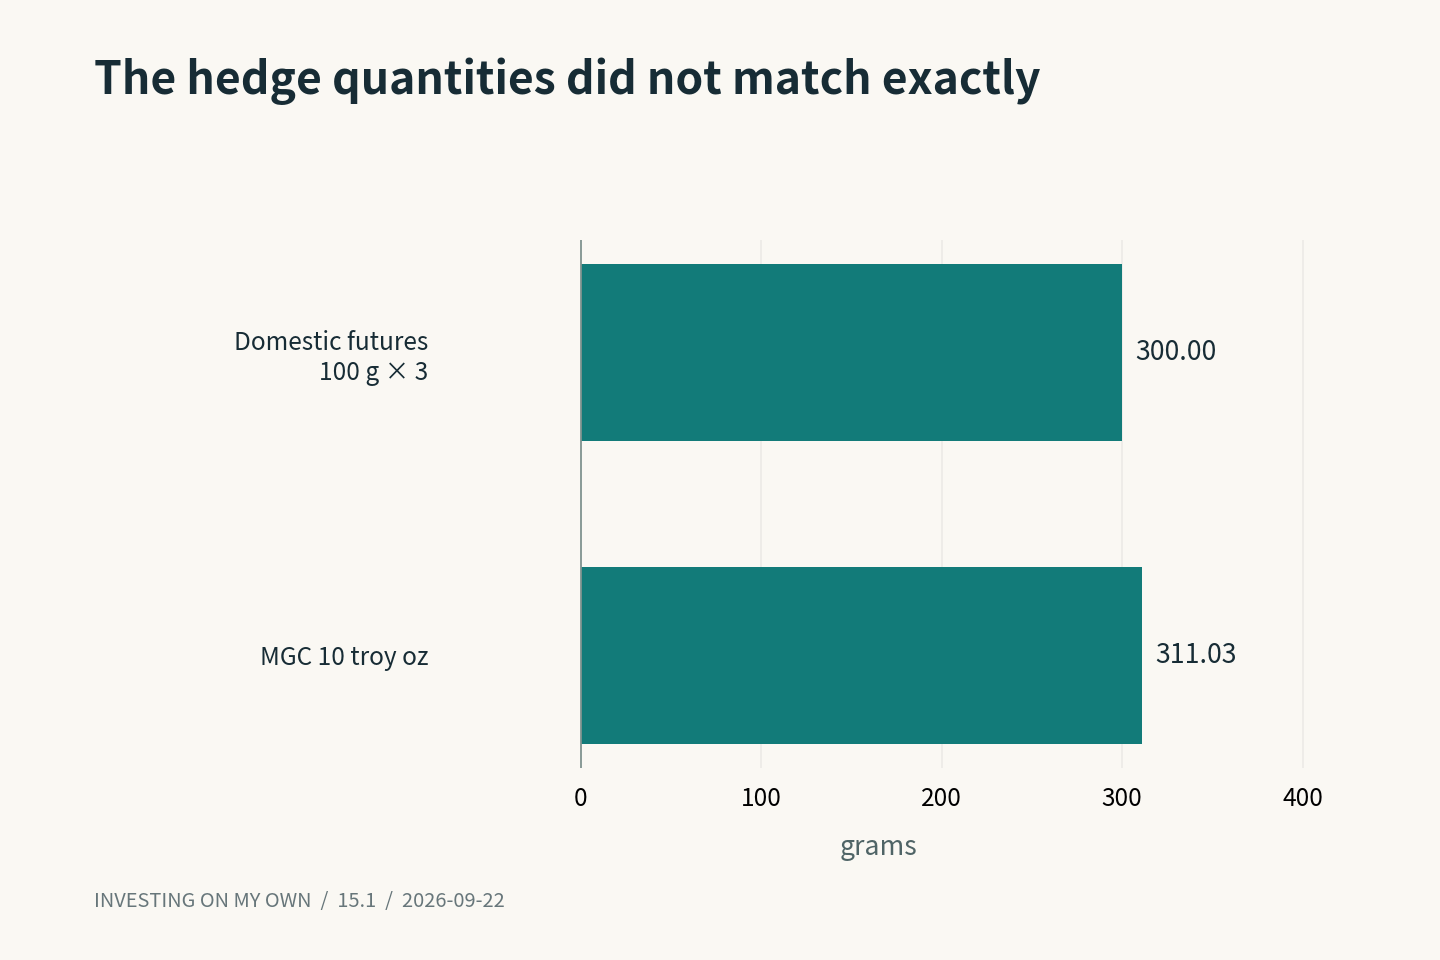
For a small account, one whole contract can be a meaningful commitment. An ideal fractional hedge and a portfolio of orderable contract quantities are different objects. Allowing arbitrary fractions would make the gold comparison easier without making it executable.
📉 Buying the domestic discount
I examined buying domestic gold spot and shorting overseas micro gold futures when Korean gold traded at a discount. The historical model also included a currency hedge.
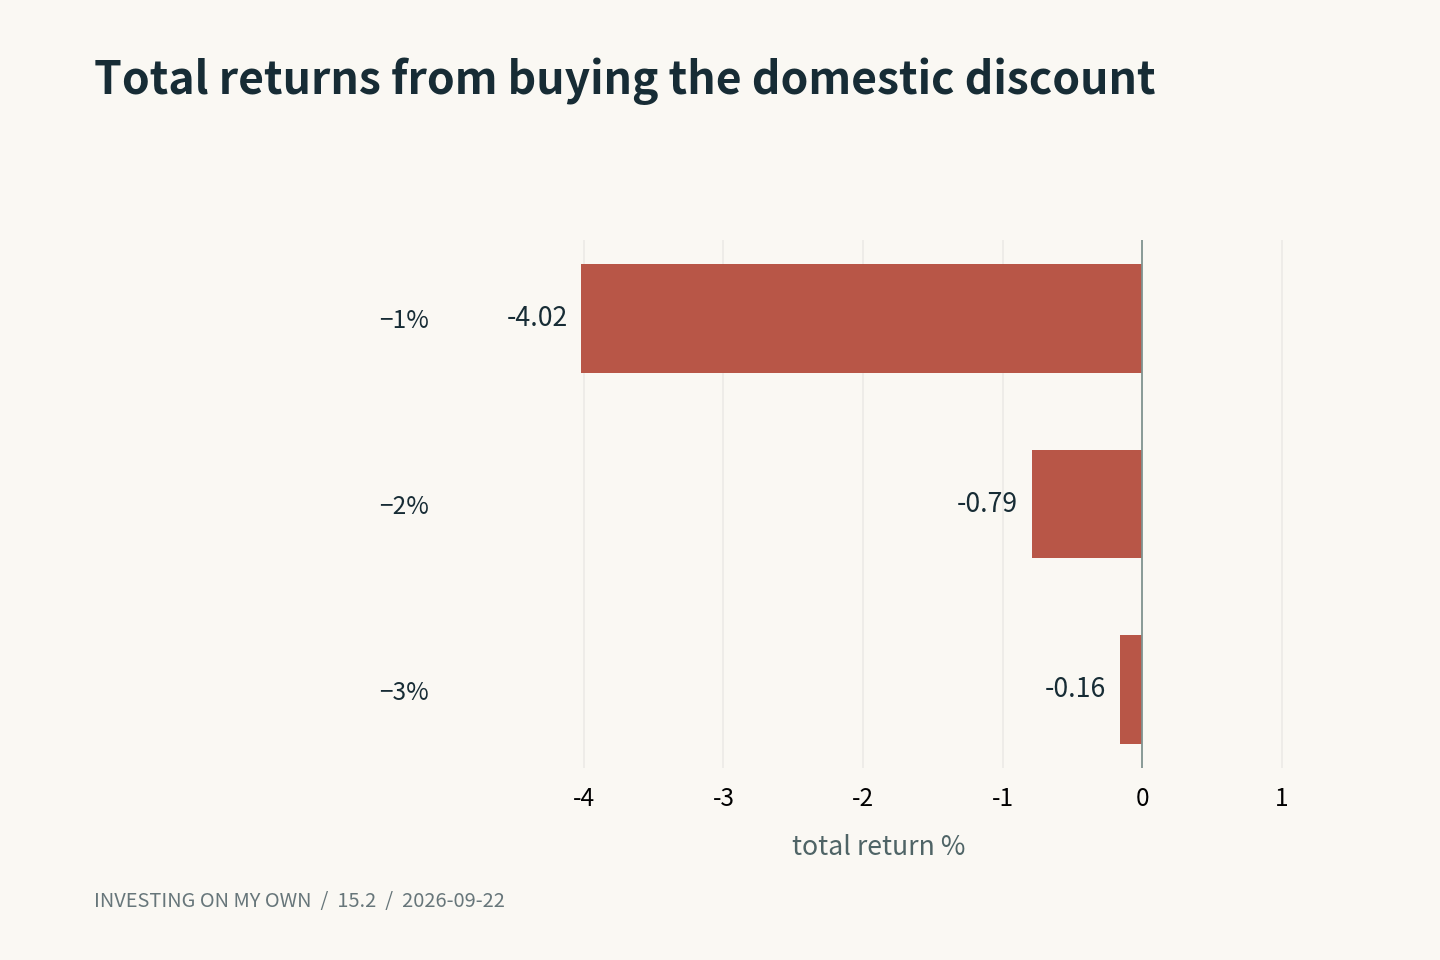
In the existing March 2014–December 2024 results, a negative 1% entry threshold produced 32 closed trades and a negative 4.02% total return on simulated capital. A negative 2% threshold produced five closes and negative 0.79%. A negative 3% threshold produced one close and negative 0.16%.
These were total returns over the full multi-year window, not annual returns. The modeled capital could remain in cash between opportunities. Waiting for a larger discount reduced trading but did not make these reported variants profitable.
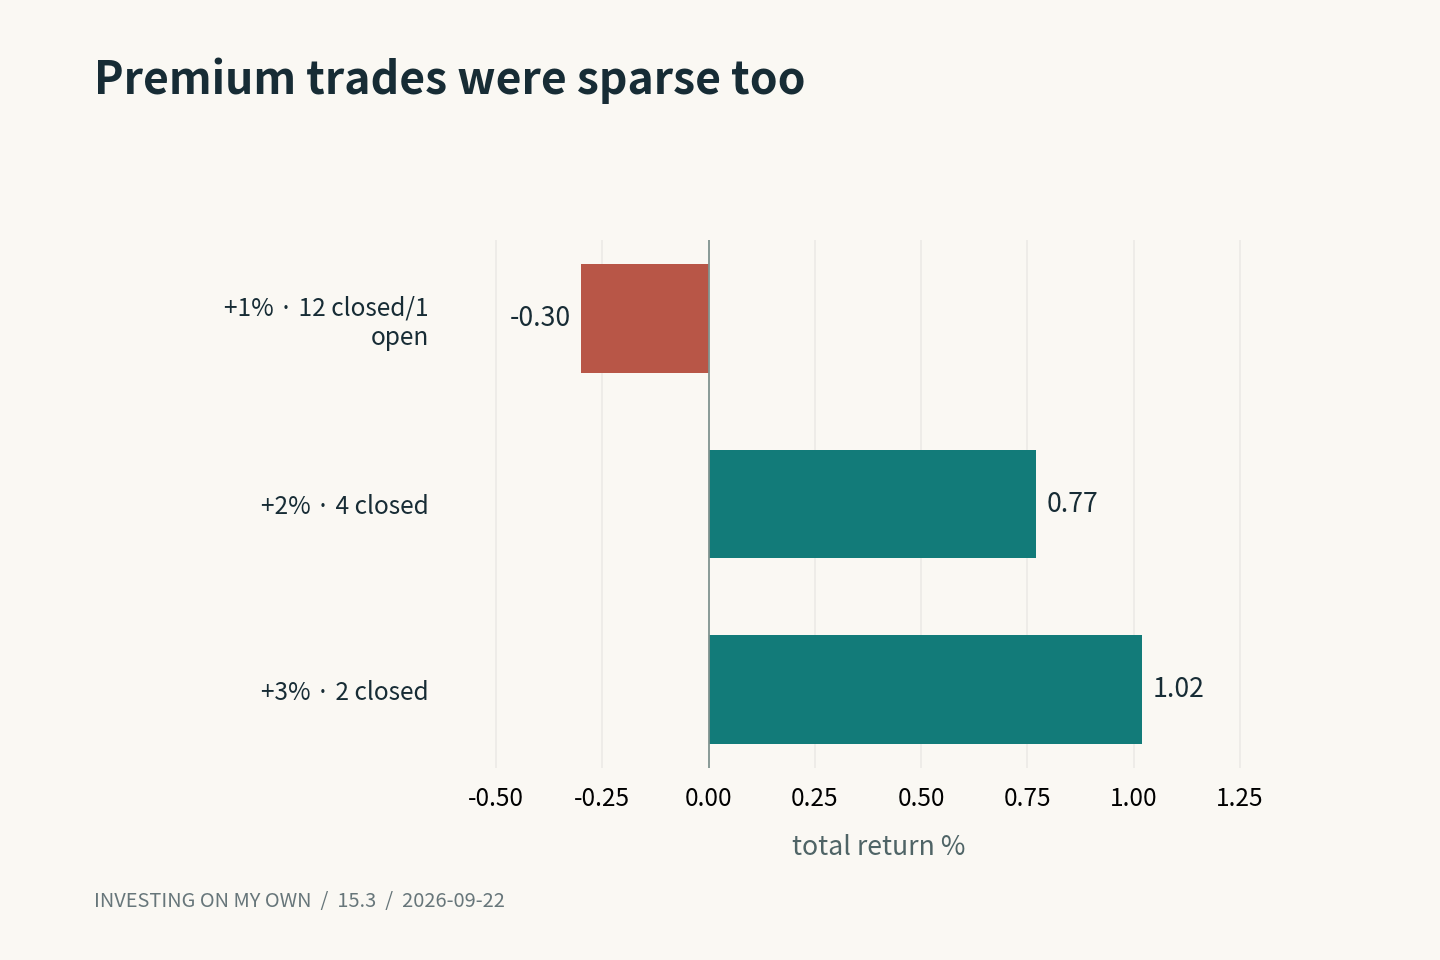
I also examined the opposite direction: short domestic gold futures and buy overseas futures when Korea traded at a premium. That evaluation covered a different window, October 2016–December 2024.
The positive 1% threshold returned approximately negative 0.30%, with 12 closed trades and one still open. The positive 2% threshold returned positive 0.77% from four closes, while positive 3% returned positive 1.02% from two.
The positive numbers came from very small samples. On the simulated KRW 100 million starting capital, the roughly KRW 770,000 gain at the 2% threshold represented the entire multi-year result, not a monthly income figure.
A slippage diagnostic of 25 basis points per side changed that approximate KRW 770,000 gain into a loss of roughly KRW 140,000. The gap between an observed premium and a robust after-cost opportunity was not large.
These figures did not justify describing the market as an easy source of arbitrage. They helped identify which assumptions mattered most, particularly sizing, the time capital stayed committed, and execution costs.
🔗 Would a gold token make the connection easier?
I also considered PAXG and XAUT. Trading a gold-linked token on a crypto exchange seemed like a potentially convenient bridge to other gold markets.
But following gold’s value was not the same as allowing every holder to redeem a small quantity into physical gold and close a cross-market price gap. Eligibility, minimum redemption size, fees, custody, and delivery conditions all required examination.
Some physical-redemption routes reviewed at the time operated at the scale of hundreds of ounces. I could not assume that a person holding a small token balance had access to the same arbitrage mechanism. Conditions also differed by product, so one minimum could not be applied to every token.
Gold ETFs raised a related distinction. A market price connected to underlying gold holdings did not imply that an ordinary investor could use the creation and redemption process available to authorized participants.
I needed to separate the institutional mechanism linking prices from the route available to my own account. Without that route, the token extension remained a study of comparable exposure and redemption conditions, not a completed risk-free-return table.
Gold initially seemed simpler to explain than crypto. Once I included currency, weight units, whole contracts, and withdrawal conditions, it became a useful demonstration of how little an identical asset label guarantees.
The most important question was no longer just how large the domestic discount looked. It was what I could hold, in which quantity, and how I could close both sides. Putting several prices on one screen was the beginning; establishing a usable path between them was most of the research.
Previous · Series index · Next