06. The kimchi premium was more complicated than I expected
FX, funding, paired orders, and the capital consumed by a second strategy.
Investing on my own · Part 6/22 · Evidence through 2026-09-22. Historical research is distinct from DRY and live execution.
The Korean crypto premium initially looked approachable. If the same coin traded at different prices in Korea and overseas, perhaps I could trade an unusually large deviation from its normal relationship.
In practice, comparing two prices was only the beginning. I had to decide how to handle exchange rates, funding, venue selection, available capital, and the possibility that only one side of a trade would fill.
🇰🇷 Between won and dollar prices
The direction I studied bought Korean spot and sold an overseas perpetual future. The intention was to offset much of the coin’s outright price exposure and trade the change in the cross-market spread. Entry still needed to clear the relevant costs.
Comparing a Korean price of one million won with an overseas price of 700 dollars requires an exchange rate. USDT adds another complication: it targets a dollar-like value, but it is not identical to a dollar.
I asked early on whether using a Korean USDT price as the foreign-exchange rate would mix together different effects. A move in USD/KRW, a Korean crypto premium, and a premium on USDT itself should not automatically become the same signal.
The overseas short also incurs or receives funding. A favorable price difference at entry can become less attractive after holding costs. The timing of an observed funding rate and the timing of the actual payment needed to be handled separately.
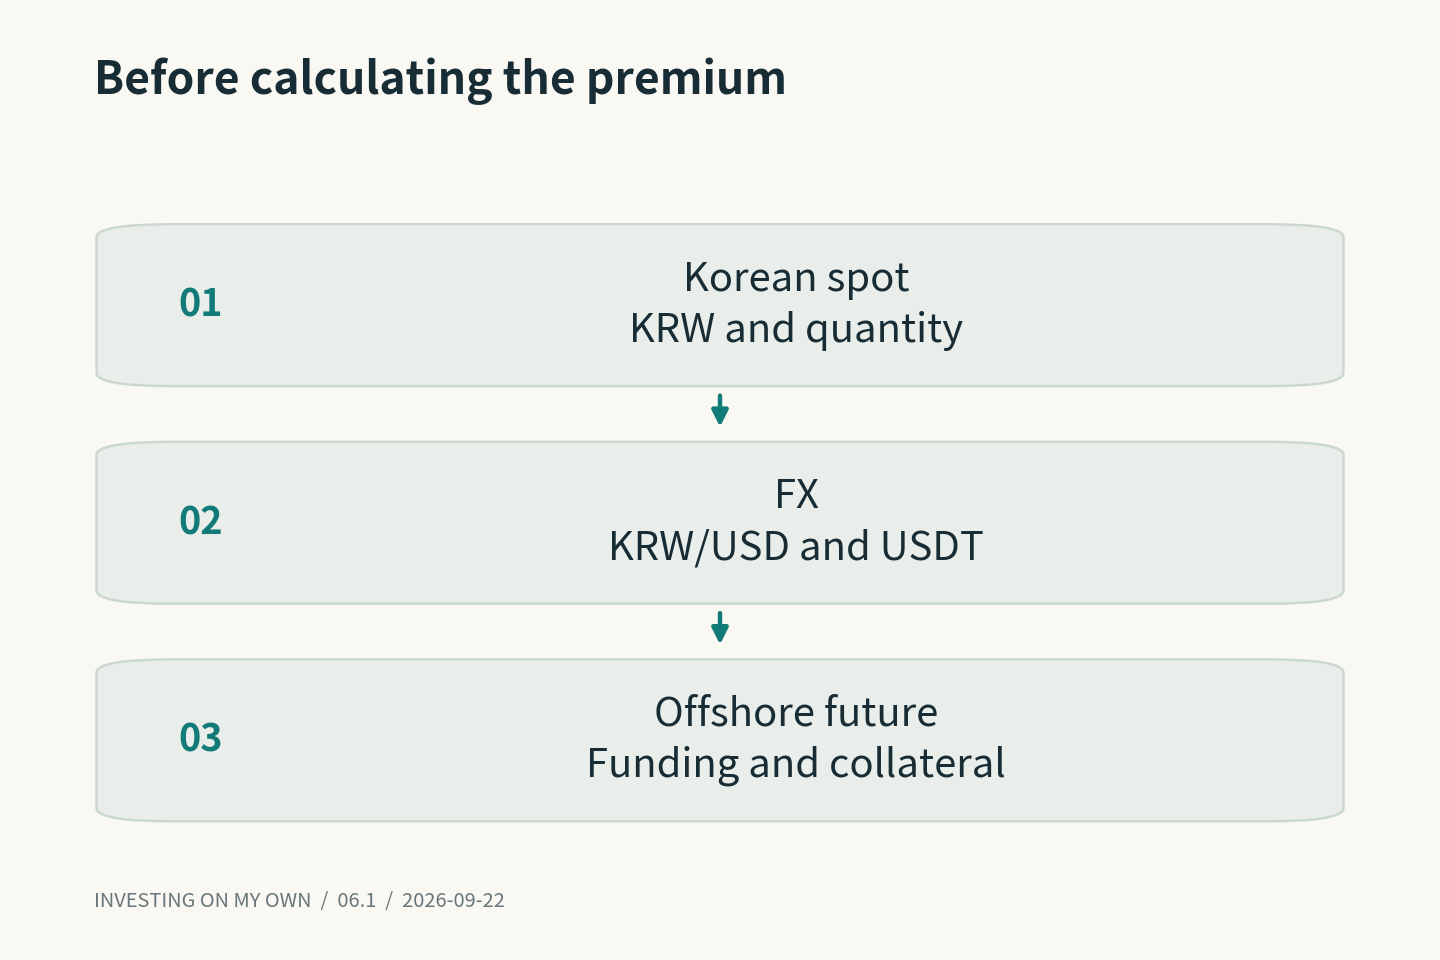
Venue selection introduced another layer. The cheapest domestic ask and highest overseas bid are useful only if enough quantity is available. Treating a tiny displayed order as the price for the entire trade can make a backtest look much better than the trade it represents.
📊 Combining it with EMA
I tested the premium strategy alongside EMA crash reversion. Their entry ideas differed, so I wanted to see whether they could complement each other. A good combined result still needed to be separated into its contributors.
One late-August experiment used 1% of account equity for EMA and 5% per leg for the premium strategy, with the latter’s total required margin capped at 30%. These settings belong to that experiment rather than every version of the system.
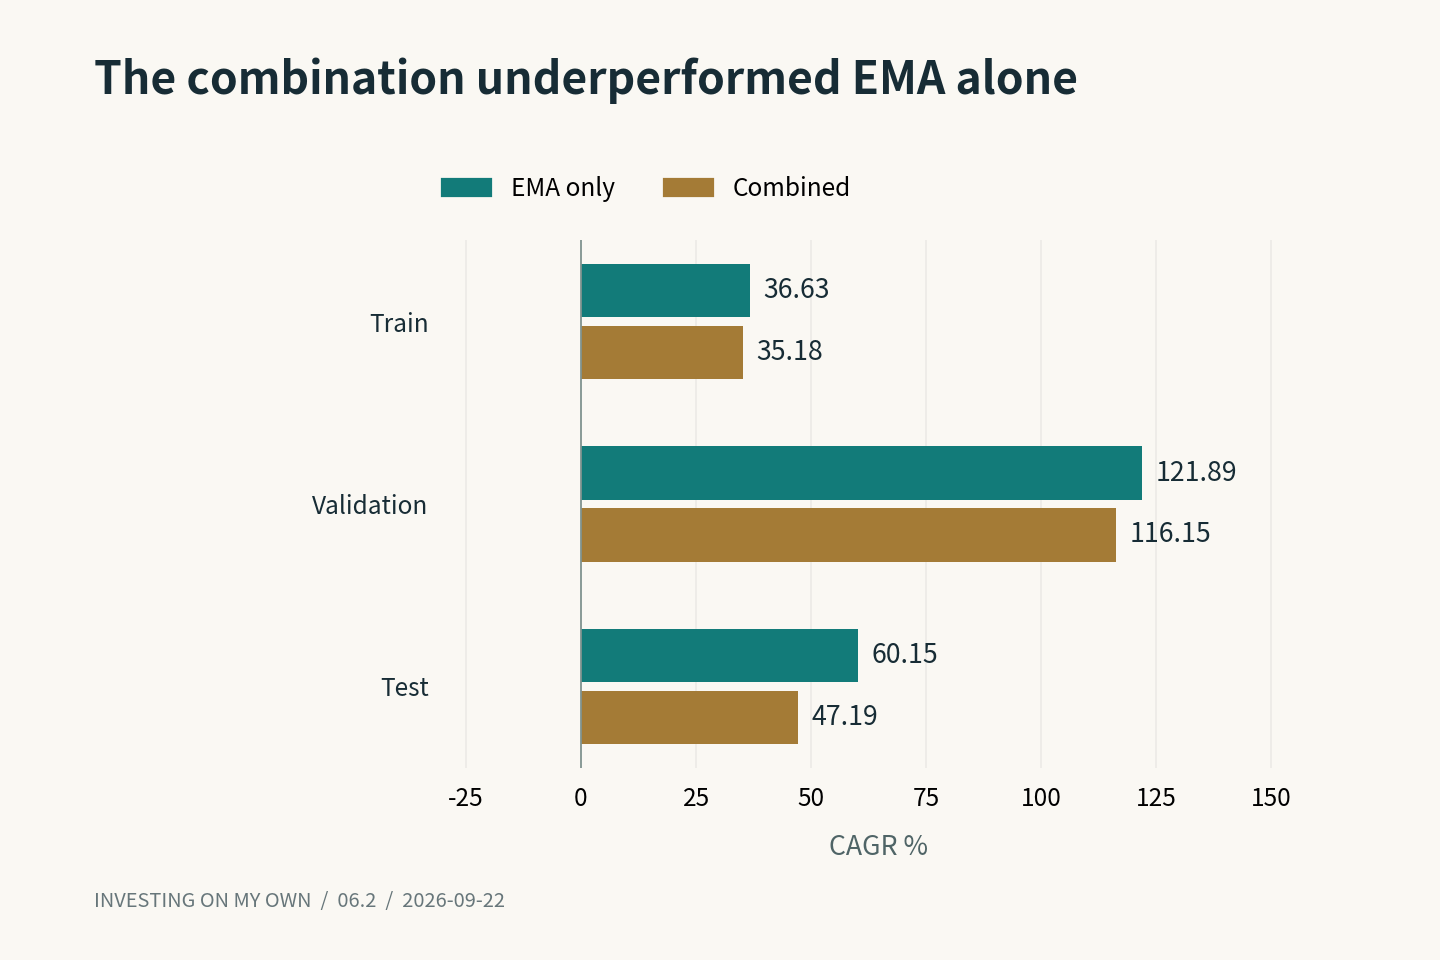
The EMA-only CAGRs were 36.63% in 2020–2024, 121.89% in 2025, and 60.15% in the 2026 test ending August 22. Combining the strategies reduced those figures to 35.18%, 116.15%, and 47.19%.
The premium strategy alone had a test CAGR of -11.19%. The attractive combined headline was mostly driven by EMA. Adding another strategy did not automatically produce a useful diversification benefit.
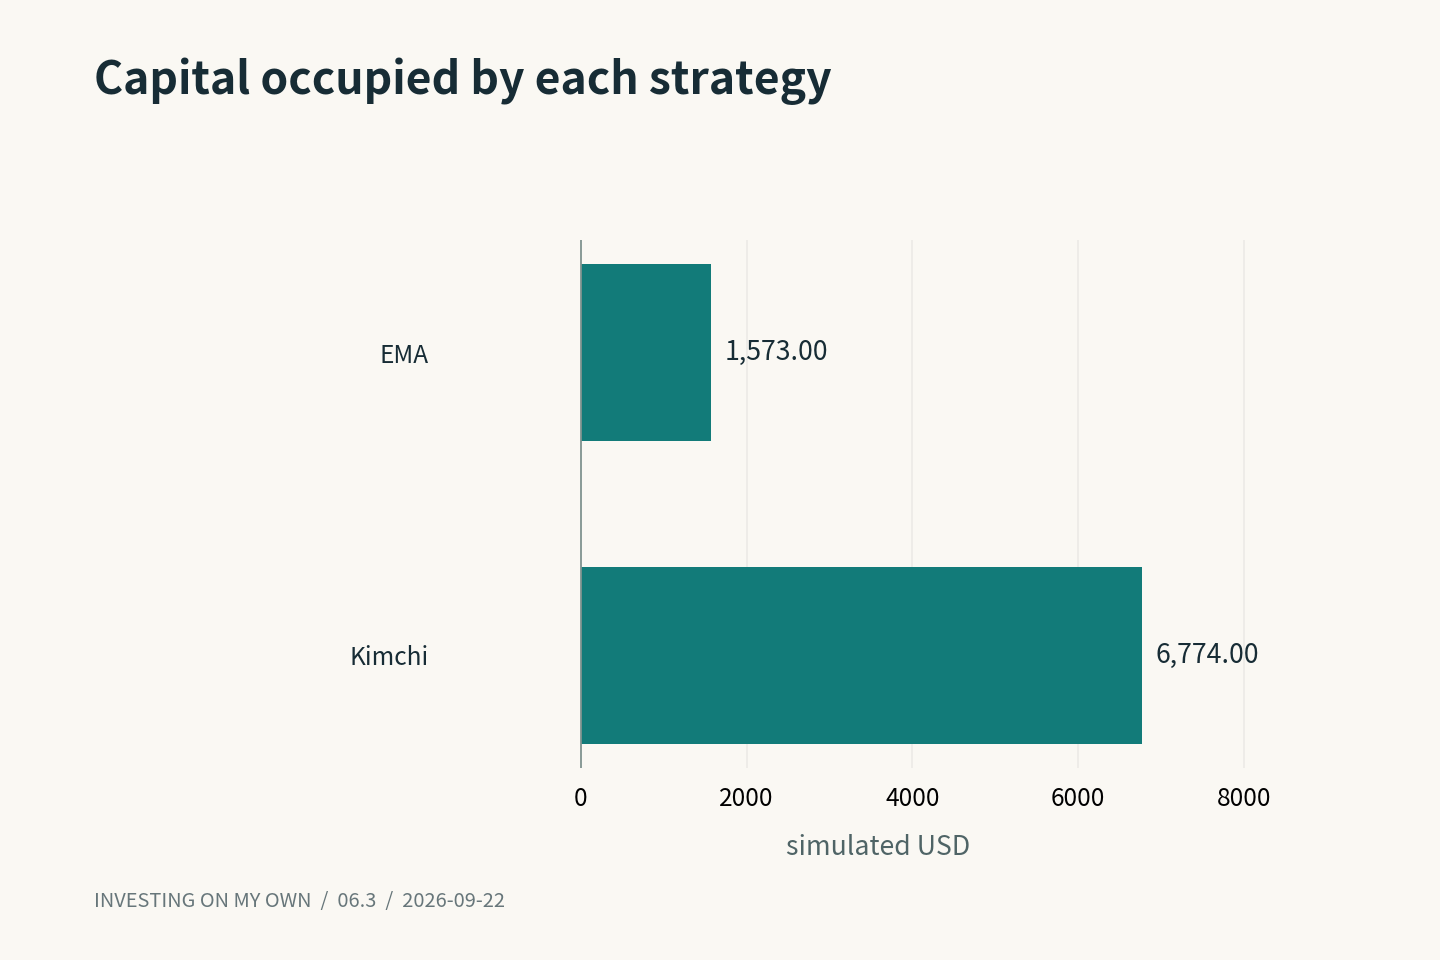
Capital usage made the comparison more interesting. Average test-period capital occupancy was approximately $6,774 for the premium strategy and $1,573 for EMA. Those are simulated amounts from the research account, not disclosed live account balances.
A strategy that contributes little or loses money can still tie up a substantial amount of capital. That capital may then be unavailable when another opportunity appears. I started examining average and maximum occupancy alongside returns.
🔧 Two orders are separate events
“Buy spot and sell the future” fits comfortably into one sentence. The exchanges do not execute that sentence as a single action. One side may fill while the other fails, temporarily leaving outright exposure.
Wallet placement also matters. An exchange may separate spot and futures balances. Having funds somewhere in an account does not prove that a particular order can be submitted. Permissions, minimum notionals, and quantity increments need to match the product.
Moving capital in an internal ledger is different from transferring money between exchanges. I preferred calculations and alerts followed by manual review for treasury movement, rather than allowing a sizing calculation to trigger an external withdrawal.
Work on actual execution and recovery continued in September. The project therefore cannot be summarized by one August backtest. The charts in this article describe the historical experiment with its stated settings.
What changed most for me was the meaning of a price difference. At first, I mainly wanted to know how large the spread was. Later, I wanted to know whether both sides could be funded, filled, held, and closed without losing the expected advantage.
The familiarity of the idea made it easy to start. Carrying it through the full calculation brought exchange rates, funding, capital occupancy, and failed orders into the same picture.
Funding eventually became a separate research question: what if receiving those payments were the main reason to hold the pair? That experiment deserves its own article, because a positive funding stream did not necessarily produce a positive total return.
Previous · Series index · Next